And why that difference is intentional.
One of the most common questions support teams hear is:
“Why doesn’t my Excel spreadsheet match PHDwin’s discounted results?”
If you’ve ever tried to reconcile the two, you already know the frustration: the inputs look right, the rate looks right, but the present value (PV) and discounted totals still drift apart.
The key is simple: Excel and PHDwin model time differently. Once you understand that, the mismatch stops being a mystery—and becomes a design choice.
QUICK SUMMARY
- Excel simplifies time by treating each month as an identical period and aggregating cash flows inside that period.
- PHDwin uses calendar time (actual days) and discounts each cash flow based on its recognition date.
- Small differences in timing compound across long forecast lives, creating noticeable discount drift.
1) The Core Issue: Excel Assumes Equal Periods
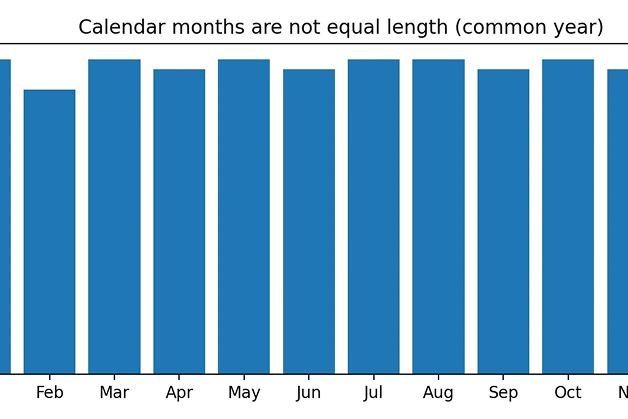
Most spreadsheet discounting workflows treat months like neat, uniform blocks. That’s convenient—but it’s also an approximation. Real months are 28–31 days long, and that difference changes how much time actually passes between cash flows.
What Excel is typically doing
- Month 1, Month 2, Month 3… are treated as identical time steps.
- All cash flows inside a month are usually combined into one number.
- Exact transaction dates are ignored (or approximated with mid‑month / end‑month assumptions).
What PHDwin is doing instead
PHDwin’s objective is to represent actual elapsed time between the discount date and each cash‑flow recognition date. When you set discounting to monthly (12 periods/year), it converts days into fractional discount periods using an average days-per-period value:
365.25 ÷ 12 = 30.4375 days per period
So a 31‑day month is slightly more than one period, and a 28‑day month is slightly less than one period. That may feel tiny—but over 10–30 years of monthly cash flows, it adds up.
Chart: Calendar months vary in length
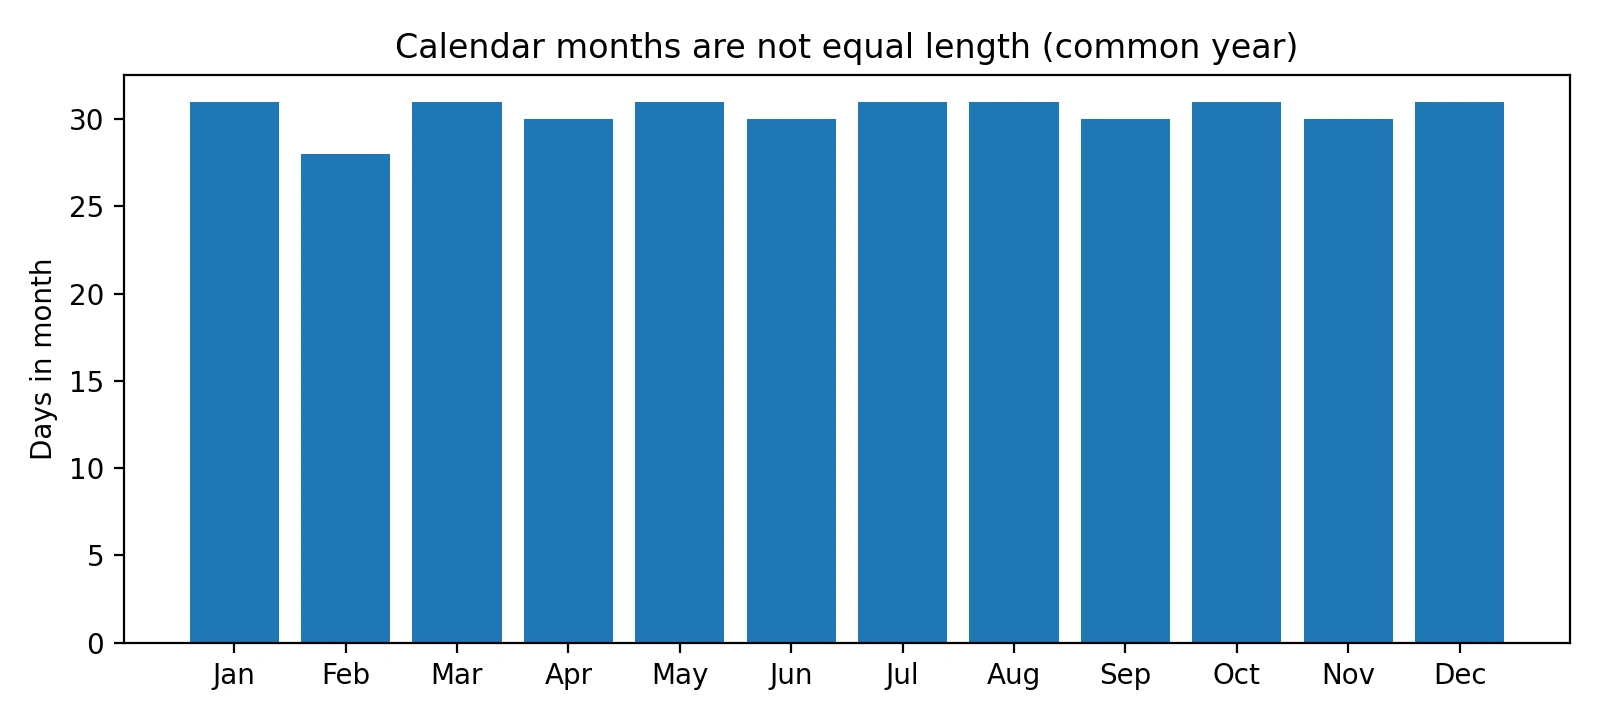
Figure 1. Month length varies (common year). Equal‑period discounting ignores this.
Chart: Fractional discount periods chart (PHDwin-style)
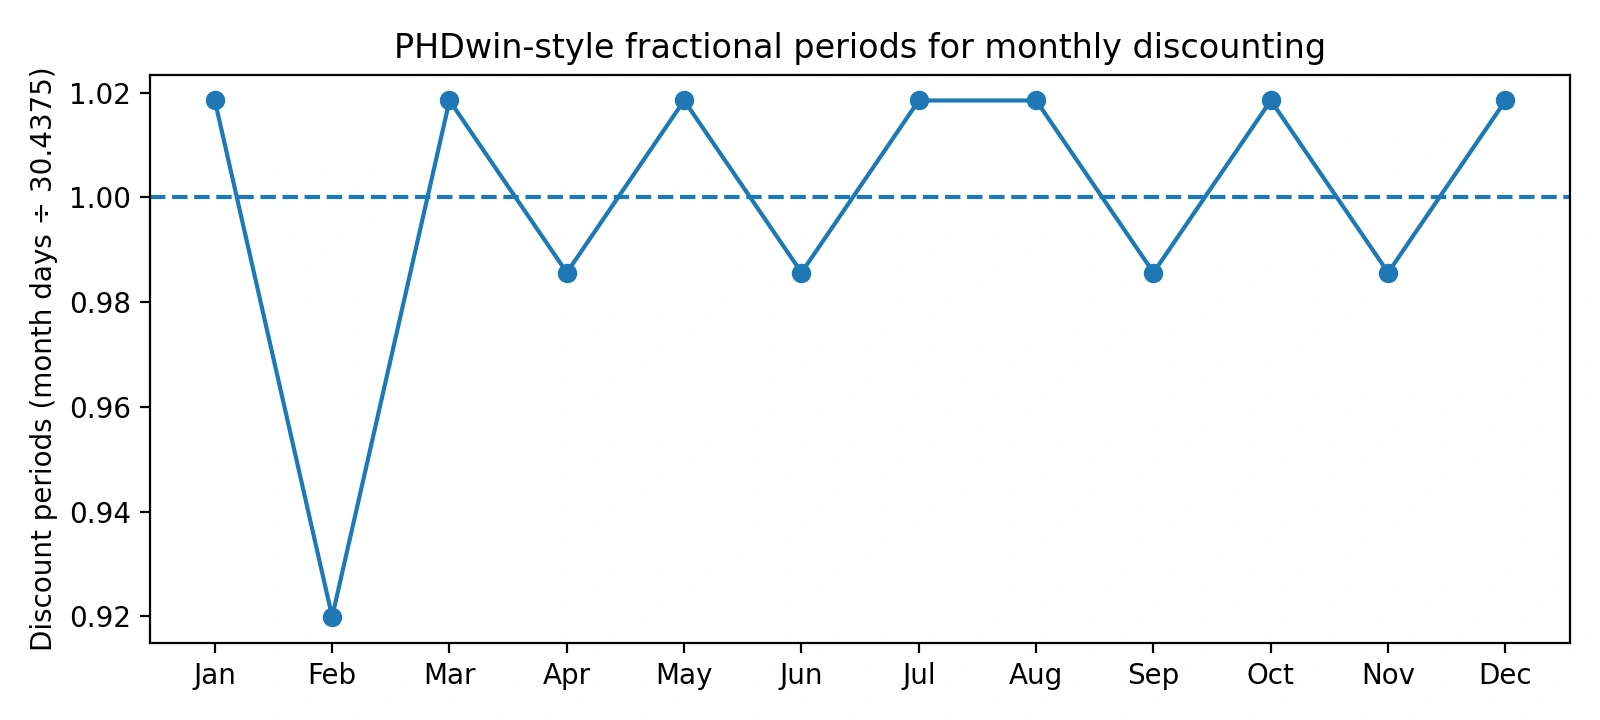
Figure 2. Converting days to discount periods creates fractional months.
A simple worked example (January)
If monthly discounting uses 30.4375 days per period, then January’s 31 days becomes:
31 ÷ 30.4375 ≈ 1.0185 periods
Excel commonly treats January as exactly 1.0 period. PHDwin treats it as 1.0185 periods—because more time actually elapsed.
2) Rate Mismatches: Nominal vs Effective Discount Rates
A second mismatch happens even when the timing logic is correct: the rate definition isn’t the same.
PHDwin uses nominal annual discount rates. In a monthly model, the nominal annual rate is divided into 12 periodic rates:
Periodic rate = (Nominal annual rate) ÷ 12
In Excel, it’s easy to accidentally use an effective annual rate (already compounded) and then compound it again monthly. That will create immediate differences in PV.
Chart: Effective vs nominal rates (monthly compounding)
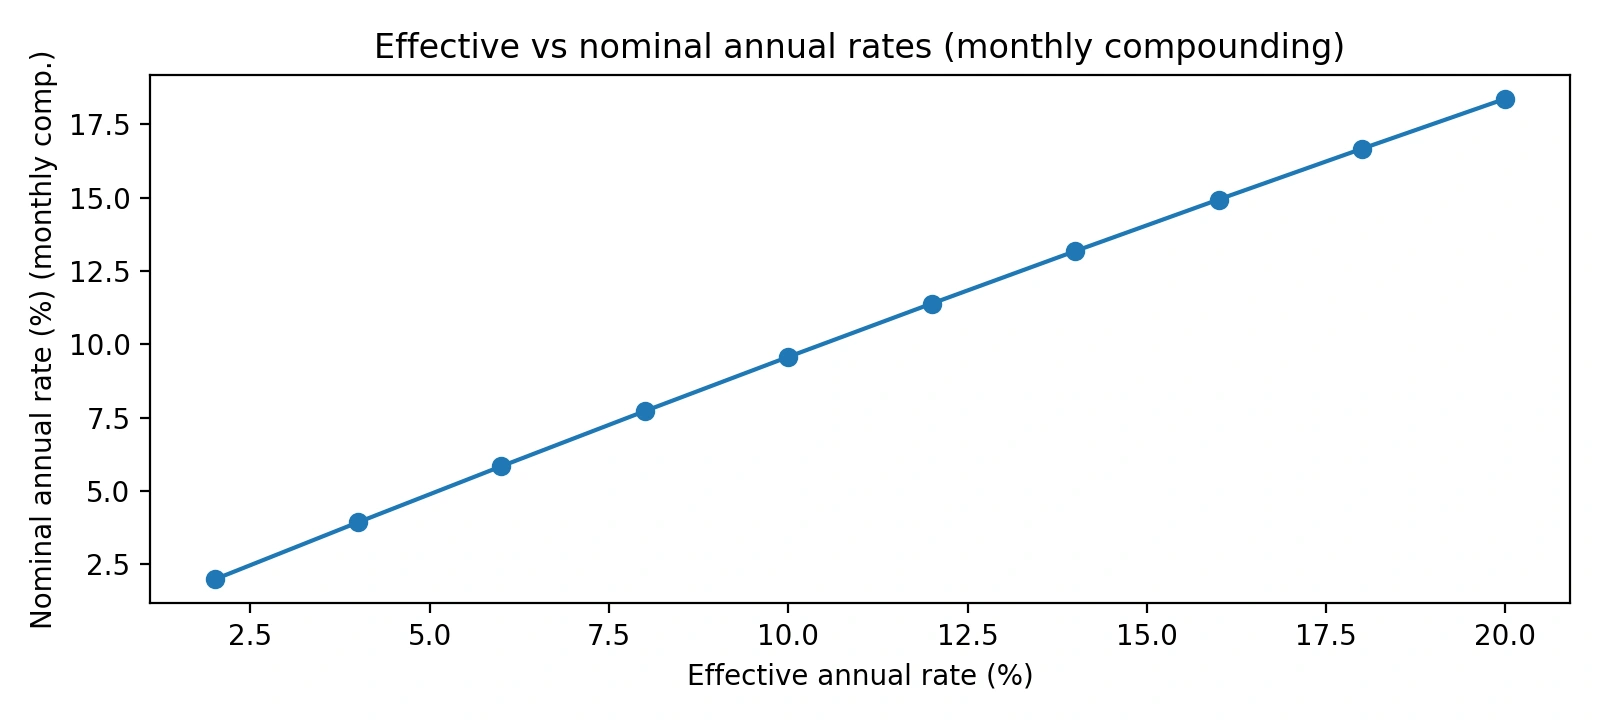
Figure 3. Effective and nominal annual rates are not interchangeable when you compound monthly.
Rule of thumb for alignment
- If your spreadsheet uses monthly discounting, make sure you’re feeding a nominal annual rate that you then divide by 12.
- If your rate source is effective (common in finance contexts), convert it first—then apply the compounding you intend.
3) Cash-Flow Timing Inside a Month Matters
Even if you agree on month length and rate type, you can still diverge if your model treats all cash flows as happening at the same moment.
Excel's common shortcut
- Capex on the 1st and revenue on the 30th are often treated as if they happened together.
- Multiple transactions in a month are aggregated into one net cash flow.
PHDwin's approach
PHDwin discounts each discrete cash flow using the exact day difference from the discount date to the recognition date, then sums the present worth of all individual items.
- Discount values for investments separately from the rest of the monthly cash flow (revenue, expenses, taxes)
- Use actual day counts from the discount date.
- Sum Present Worth (PW) values to get totals.
Chart: Discount drift grows with horizon (illustrative)
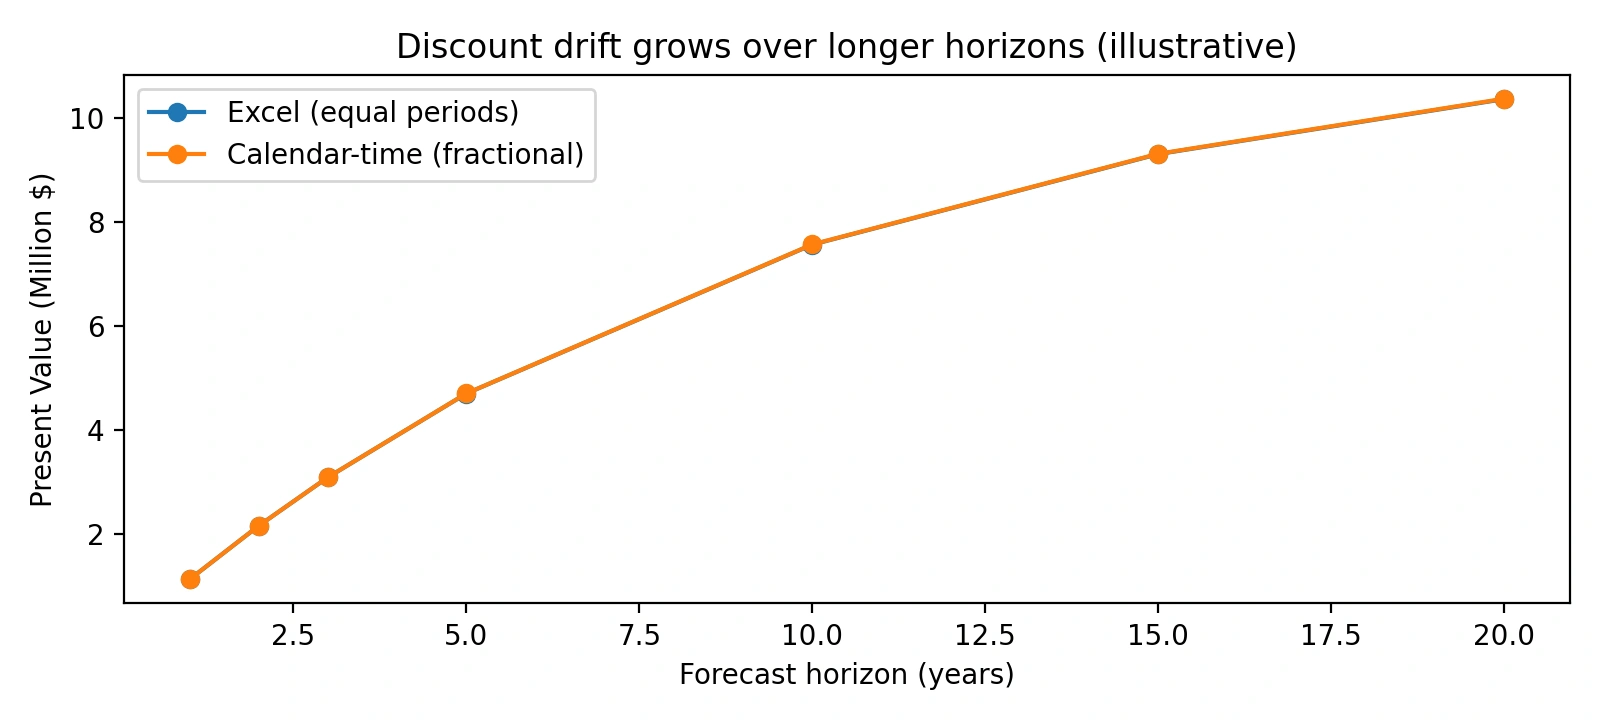
Figure 4. Small timing differences compound over longer forecast lives, causing drift.
Why matching PHDwin perfectly in Excel is hard
You can recreate PHDwin-style discounting in Excel—but you’d need a more granular model than most spreadsheets are built for:
- A row-level schedule separating investments and the rest of monthly cash flow (revenue, expenses, taxes) with their respective recognition dates.
- Day-count logic to convert elapsed days into fractional discount periods.
- A consistent nominal-rate convention and compounding frequency.
- No temporal aggregation until after PW is computed for each cash flow.
Bottom Line
If your Excel discounting doesn’t match PHDwin, that doesn’t automatically mean Excel is “wrong” or PHDwin is “inconsistent.” It usually means the underlying time assumptions are different.
Excel prioritizes simplicity and ease of modeling.
PHDwin prioritizes calendar-accurate, time-weighted valuation.
Recommended next steps
- Decide whether you want equal-period or calendar-time discounting for your use case.
- Confirm your rate is nominal vs effective, then apply compounding once.
- If you need an Excel tie-out, move from monthly aggregation to dated cash-flow discounting.
FAQ
Q: Why does Excel discounting differ from PHDwin?
A: Because Excel often assumes equal monthly periods and aggregates cash flows, while PHDwin uses actual calendar days and discounts each cash flow using its recognition date.
Q: Is Excel discounting incorrect?
A: Not necessarily. It’s often a reasonable approximation—just less precise for long, monthly, date-sensitive forecasts.
Q: Can Excel replicate PHDwin calculations?
A: Yes, but only with dated cash flows, day-count logic, correct nominal-rate handling, and minimal aggregation.
Q: What is discount drift?
A: It’s the gradual divergence in PV totals that builds when two models handle time slightly differently across many periods.
GLOSSARY
Discount date: The reference date from which all present worth (PW) calculations are measured.
Calendar Time: Elapsed time measured in days, accounting for month length and leap years.
Day‑Count Convention: The rule that converts days into discounting periods (e.g., 365.25 days/year).
Effective Discount Rate: A rate that already incorporates compounding over the year.
Nominal Discount Rate: A stated annual rate that is split into periodic rates (e.g., divided by 12 for monthly).
Fractional Period: A discount period that is not a whole number because the elapsed days don’t equal one full compounding period.
Temporal Aggregation: Combining multiple cash flows into a single monthly value before discounting.
Present Worth (PW): The current value of a future cash flow after discounting.